
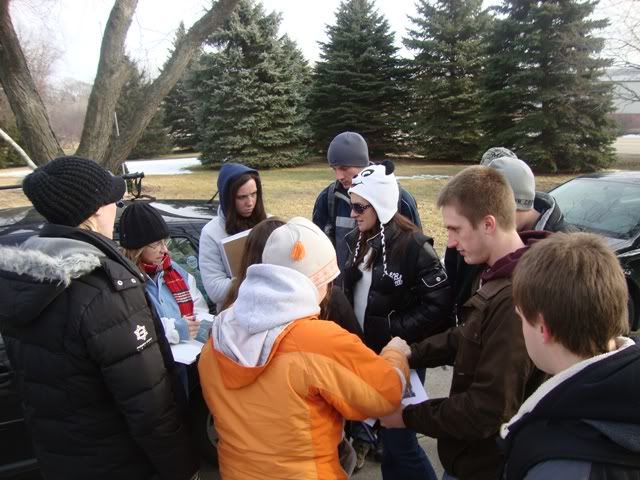
Above: the exciting world of sitting behind a computer and conducting GIS analyses!
Although field work is really what the lab for this class is all about (see here and here), occassionally you have to come inside and analyze your data.
The first time we're doing this in class involves GPS data and Geographical Information Systems (or GIS).
GIS is a great tool to have experience with. In fact, an ecologist interested in monitoring, biogeography, resource selection (e.g., habitat selection, etc.) and spatial ecology can do these much more effectively if they can use GIS.
Now....as I've said, it's an invaluable skill to learn.....but that comes at a cost.
The software can be amazingly frustrating to work with (powerful though it may be).
It's finnicky. It's picky. It occassionally works or doesn't work for no other reason that I can determine aside from there being gremlins inside of the computer. Furthermore, every time the manufacturers update the software, one has to relearn how to do alot of simple commands...which is annoying.
However, if you can learn to use it and not get frustrated, you are on your way to knowing an invaluable skill (and a marketable skill, for all of you budding ecologists).
Many kids of the age to be undergraduates in college have grown up with technology, which works in their favor for learning GIS. However, they have grown up with technology that is very user-friendly. If it doesn't work...most technology the kiddies play with has buttons they can smash around on and eventually get what they want. GIS is not that way. It is not intuitive and will not work itself out if you "play around" with it. So not knowing the proper steps to conduct an analysis (or not following the steps you've been provided) will result in heartache.
Ultimately, one has to look past their frustration to see what GIS can provide and how useful it really is.
All of this must make it sound as if I don't like GIS, which is not the case. I love it! It's an amazing tool.
Yet, this fact may not sink in until after one is done spending hours in a computer lab......has gone home to unwind....AND had a chance to think about some of the cool stuff they've made with GIS.
____________________________________________________________________
But before you have to sit behind a computer, you get to go out in the field and collect some data! In our case, we were using GPS units to delineate habitat boundaries on-site so that they could later be uploaded on an aerial photo in GIS. This was done several weeks prior in the field.
First, the student groups got together and tried to determine which group would collect GPS points for which habitat communities by reviewing an aerial photo of the site.
This is an important step. Collecting data incorrectly, or not being clear on which groups would be delineating which areas can lead to overlap and wasted time....OR not collecting enough data points (which the students learned the hard way).
Next, each group headed out to their locations to start collecting data.

....once at a desired location, the unit is fired up and a reading is taken.

Next, the data points are organized and appropriately formatted into spreadsheets. This is where the headaches can arise. The GIS software we use is very, very picky. A space in the wrong place, an incorrectly formatted value, a spreadsheet saved incorrectly all can result in things not working for no apparent reason. Perserverence is neccessary!
But, once you are done...you may just get lucky enough to have a cool aerial photo with your habitat community types perfectly delineated as a polygon based on your GPS coordinates. You can also measure the areas of a given habitat type to determine the proportion it is of your overall study site (a very useful bit of information).
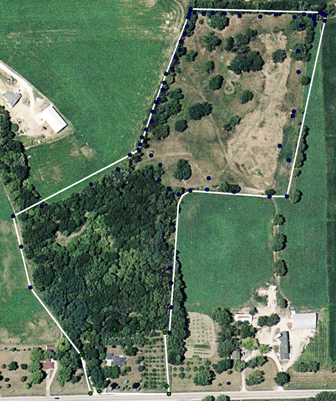
Above: one of the students' final maps. All of the data points were collected in the field. Note that the polygons don't follow each GPS point exacty (particuarly obvious in the upper right). We made these as Minimum Convex Polygons, and thus the program basically connects the outer-most dots when making a polygon. A good first stab and it took most of a three hour lab to get this. If making maps for this site was a semester long project, the example above would need to be refined.

Above: another one of the final maps made in lab. This one contains different-colored polygons that encircle various habitats present on-site ("disturbed", woodland, oak savannah). The blue polygon represents where the tree quadrats/samples were collected during week 3.
The students made some nice looking maps. Unfortunately, working in the GIS lab meant we didn't get out to our camera traps....and we are on a hiatus during week 5. So, three weeks worth of pictures will be forthcoming in the near future.
Can't wait to see YOUR results, across the country!
ReplyDeleteThose are some pretty nice maps. Is this a free program on one of those absurdly expensive science programs?
DeleteThanks, JK!
DeleteUnfortunately, it's one of those ridiculously expensive ones.
The only way we have access to it is because the university has a site-license that many faculty and courses make use of....