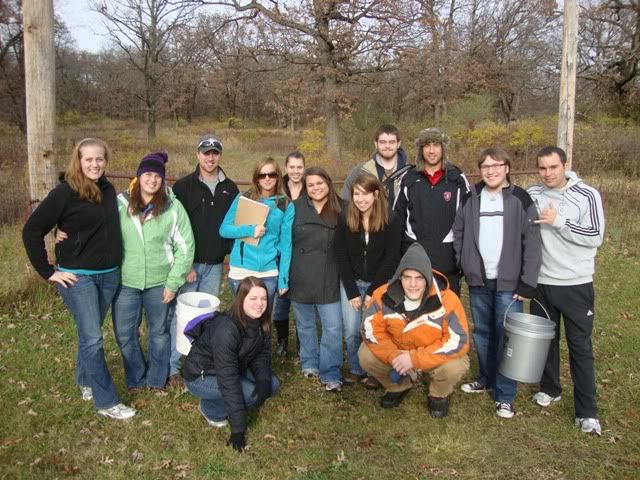
Above: advanced Ecology students, fall 2011, prepared to go out and check their camera traps!
Traditional methods used to estimate wildlife abundance/population size typically involve some sort of capture/mark/recapture technique. In other words, you go out one day....catch a bunch of animals in traps...give them a unique mark (i.e. an ear tag, etc.)....release them and then on day two see how many marked animals from the previous day that you recapture. The calculation involves a comparison of the ratio of marked to unmarked animals caught during the two days, and this allows you to estimate the population size.
With camera traps, these traditional capture/mark/recapture methods can be difficult to use. Some species allow researchers to identify individuals via unique natural marks/patterns (ocelots, jaguars, tigers, etc.). Identification of individuals via natural markings is alittle more tricky with the critters in the upper Midwest. Most raccoons and white-tailed deer are hard to distinguish from one another. If, for example, you obtain three pictures of coyotes over three days (1 coyote during each day), it's pretty hard to tell if this is the same individual on three occasions...or three different individuals. Of course, one could trap them and put ear tags on them, etc...but to do this creates a laundry-list of other issues (not the least of which being acquisition of proper permits).
There is, however, a model that allows for researchers to estimate animal abundance with capture-only data (i.e. no recapture data of marked individuals). It's called the Royle-Nichols Model (Royle & Nichols, 2003), and is perfect for analyzing the type of data frequently generated by camera traps (i.e., pictures where it can be difficult to tell individuals apart over time). This model assumes that the probability of capturing an animal is a function of how abundant that animal is on-site. In other words, an animal that is captured frequently by camera traps probably has a high abundance, and the model can calculate this abundance for you.
So between learning the application of this abundance-estimate model and getting to work with camera traps in the field.....the field ecology students involved in this exercise are gaining some great applied skills.
So it was that our advanced ecology students found themselves wandering through the woods at large woodland restoration site about 1/2 hr from campus.
Note: ignore the date and time stamps on the pics below. I'm not sure if these are programming issues or malfunctions, but we obviously were not out there in January of 2009!
____________________________________________________________________
The students and I started off by deploying the cameras.....
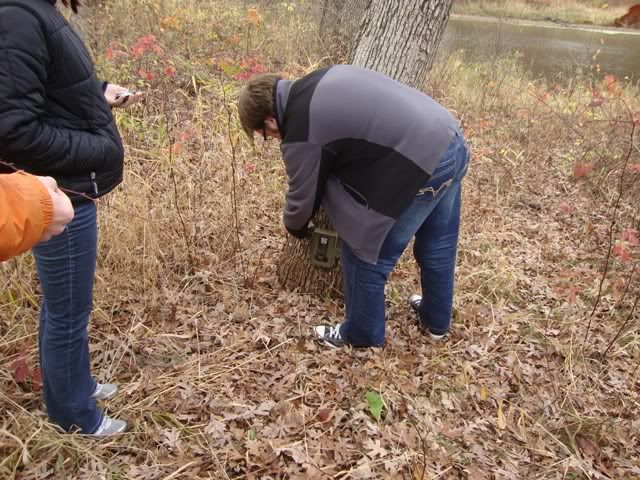

...next we carefully checked them to make sure they were on.....
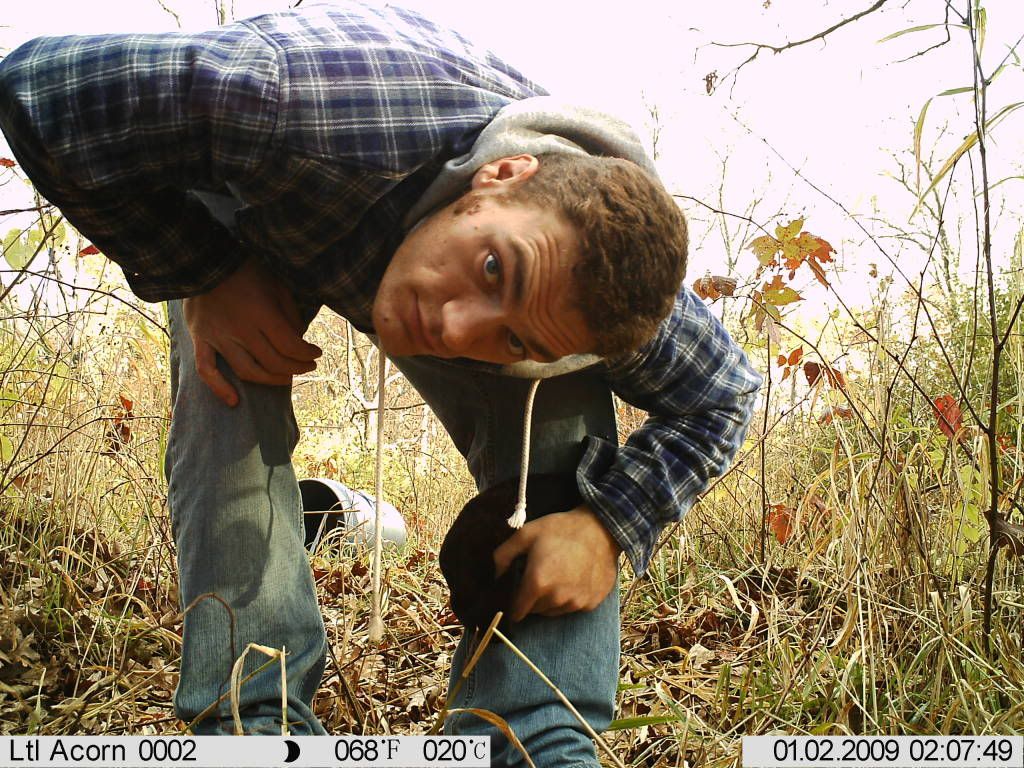
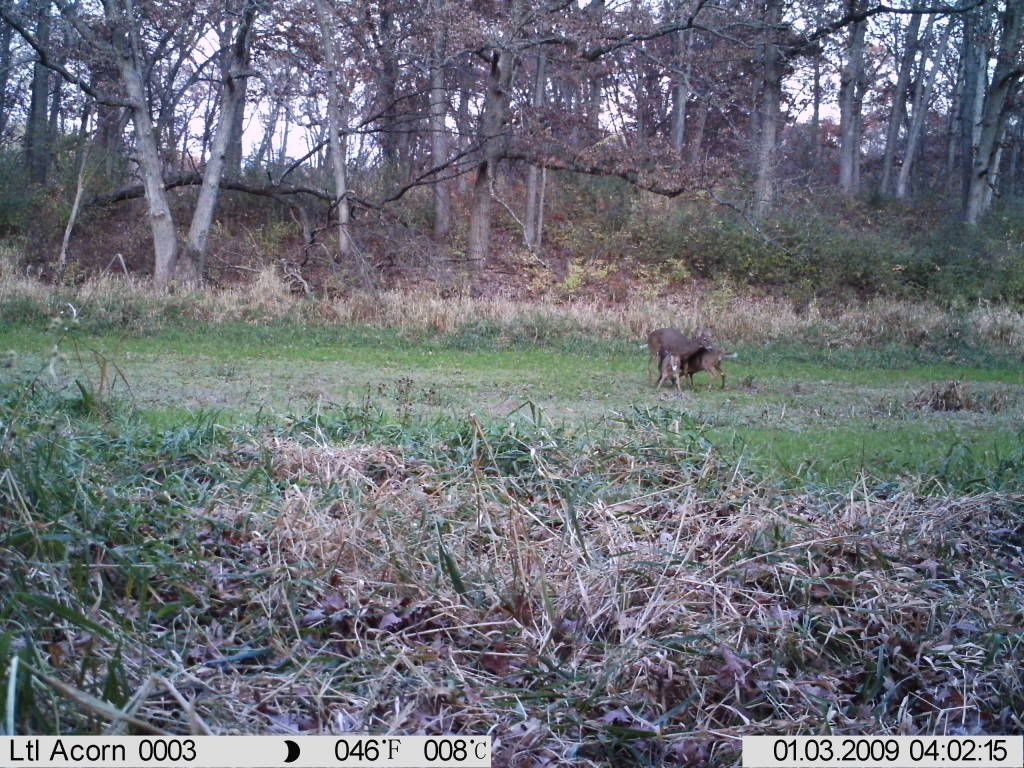
...of course, in our absence, the critters were nice enough to do the same.....


We pulled the cameras and checked the pictures back in the lab. As it turned out, we had three species to work with for our exercise in estimating population size with capture-only data.
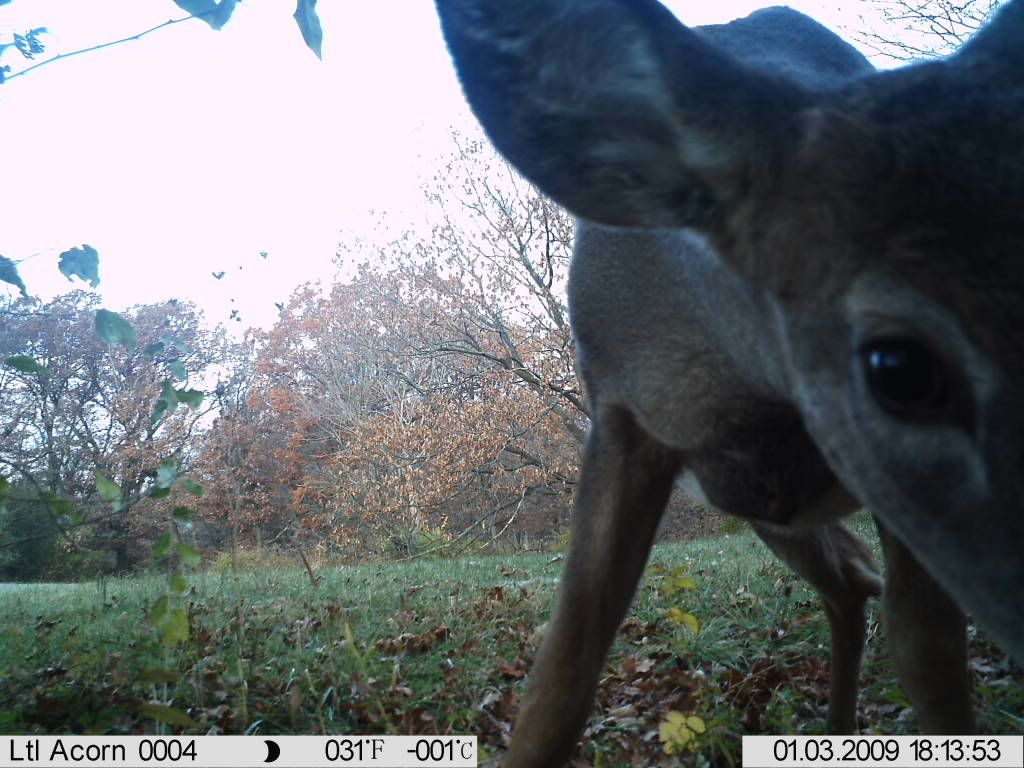
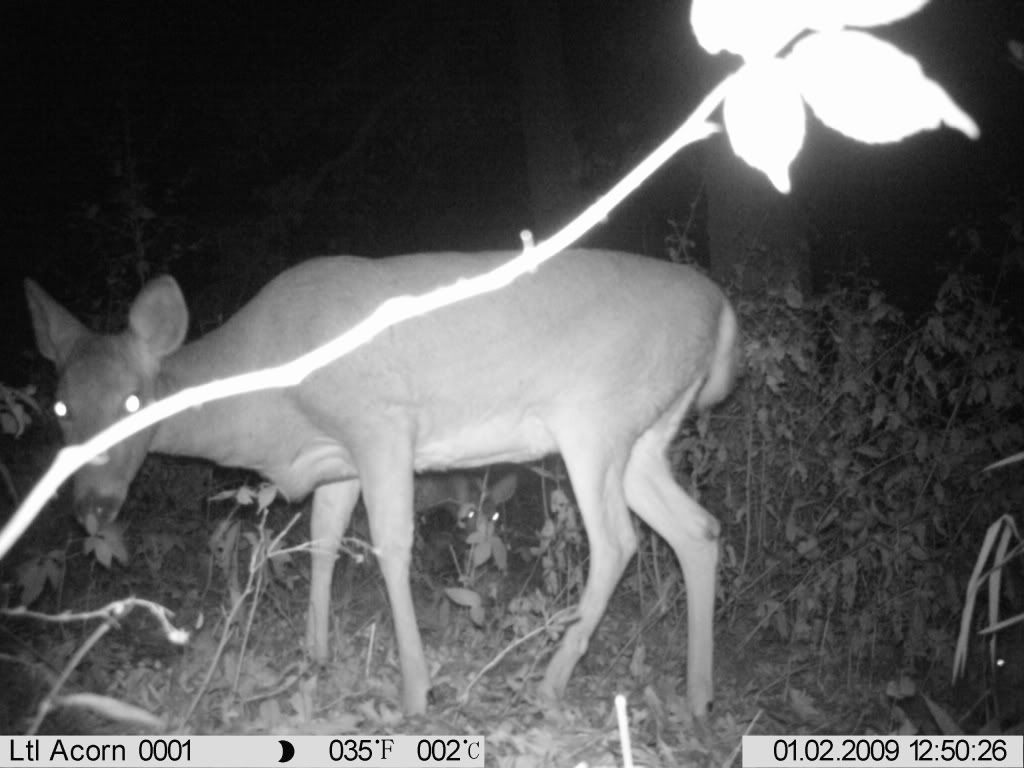
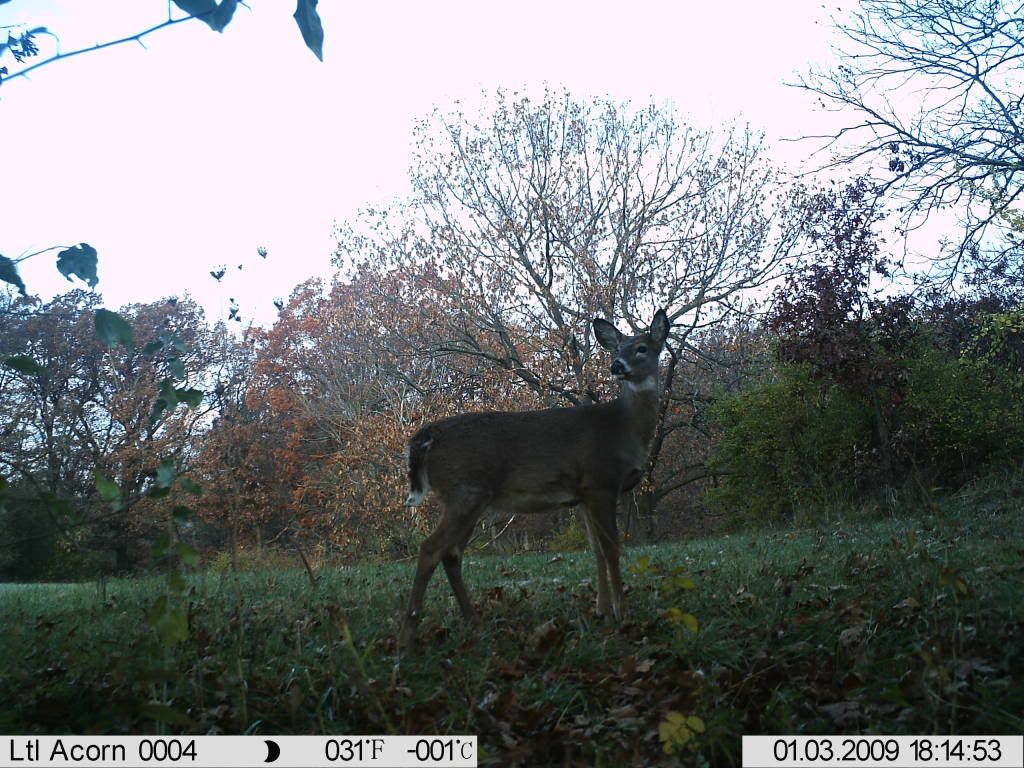
The ubiquitous White-tailed Deer (Odocoileus virginianus)
The wily Racoon (Procyon lotor)

And the Fox Squirrel (Sciurus niger)....at first I had just written this off as an Eastern Gray Squirrel (it's too easy to resort to calling any squirrel an eastern gray 'round here!)...but was luckily set straight by JVN over at Backyard Beasts!

Every camera caught pictures of something....and even got some pretty neat shots (I'll hopefully post more of these later as well).
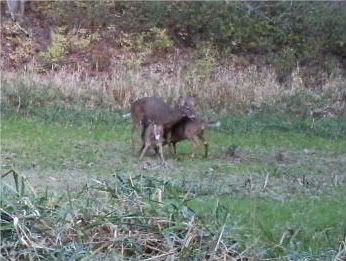
A rather nicely posed doe....
...see cropped and zoomed in version of this picture below....you can almost feel why she appears to be wincing!

So we came back and the students compiled their data for all three species. This included four survey locations (cameras) over seven survey periods (days). At the end, the Royle-Nichols model gives us the following information:
- Abundance (with confidence intervals)
- Average Abundance / Survey Location
- Detection Probability
The confidence intervals and the detection probability estimate provide means by which we can assess how strong our estimates of abundance are.
Could I provide you with our results? Sure.
But....why cheat you out of the opportunity to learn how to do this for yourselves?
(Really...the students haven't turned in their abundance estimates yet, which was part of their homework assignment. I don't want the answers freely available on the internet, should they HAPPEN to see my blog). :)
Literature Cited:
Royle, J.A., and J.D. Nichols. 2003. Estimating abundance from repeated presence-absence data or point counts. Ecology 84:777-790.
Hey Trailblazer,
ReplyDeleteI love to see others learning about these things. It looks like you have a bunch of bright eyed, enthusiastic students, as well as enthusiastic animals. I bet you just love your job:) Great pics!
Bill
What a great class! I would've loved to take a class like yours.
ReplyDeleteI downloaded the paper, thinking that I could make some population estimates based on my camera traps. I thought that it would be a quick calculation. WRONG!
As I waded through the paper, I kept thinking that I thought that I had retired from this kind of stuff :) But, one can never truly retire from being a biologist. That's the biggest lesson that I've learned...
Today someone left a gut pile in my backyard. I was not happy with the trespassing hunter... but I did point a cam at it to see who eats it.